Cpio Review / BEA / Trade Deficit
Trade Deficit Slips to $105.0B in September: A GDP Growth Input
The U.S. trade deficit narrowed to $105.0 billion in September as exports rose $5.8 billion and imports $5.2 billion. What the BEA data mean for GDP growth.
The U.S. goods and services trade deficit was $105.0 billion in September, down $0.7 billion from a revised $105.7 billion in August, the Census Bureau and the Bureau of Economic Analysis reported on November 4. The change is small, and the monthly movement matters less to GDP growth than the composition underneath it, where exports and imports both rose and the pattern of goods shifted toward computers and capital equipment.
A smaller gap built from larger flows
September exports were $321.5 billion, up $5.8 billion from August, a gain of 1.9%. Imports were $426.6 billion, up $5.2 billion, or 1.2%. The deficit narrowed because exports climbed by slightly more than imports, not because trade shrank. The goods deficit fell $0.7 billion to $135.9 billion, while the services surplus slipped by less than $0.1 billion to $30.9 billion.
The agencies note that statistical significance is not applicable or not measurable for the monthly changes, so a $0.7 billion move should be treated as a rounding-scale shift in a $400 billion-plus monthly flow. Both agencies also revised August: exports of goods rose $0.2 billion, exports of services $0.3 billion, imports of goods $0.2 billion and imports of services $0.4 billion.
Year to date the picture is different. The deficit through September is $92.4 billion, or 12.2%, smaller than in the same period of 2025. Exports increased $297.3 billion, or 11.6%, and imports increased $204.9 billion, or 6.2%. Exports have grown almost twice as fast as imports, which accounts for the narrower cumulative gap.
The three-month view points the other way
The monthly figure and the three-month average disagree. The average deficit for the three months ending in September rose $11.3 billion to $101.2 billion. Average exports rose $1.4 billion to $316.0 billion, while average imports rose $12.7 billion to $417.2 billion. Compared with the three months ending in September 2025, the average deficit is $36.5 billion wider, with average exports up $28.9 billion and average imports up $65.4 billion.
That means three comparisons give three readings: the month is slightly better, the year-to-date total is better than 2025, and the recent three-month average is worse than the prior three-month average and than a year ago. A reader who takes only one of them will draw a different conclusion from a reader who takes another.
What moved
On exports of goods, which rose $5.1 billion to $211.0 billion, capital goods were up $3.8 billion, with computers up $1.3 billion, computer accessories up $0.8 billion and civilian aircraft up $0.7 billion. Foods, feeds and beverages added $1.9 billion, with soybeans up $1.3 billion. Consumer goods rose $0.8 billion, led by a $0.7 billion increase in pharmaceutical preparations. Crude oil exports were up $1.2 billion. A $1.0 billion decline in industrial supplies and materials reflected a $3.4 billion drop in nonmonetary gold.
Goods imports rose $4.4 billion to $346.9 billion. Capital goods imports were up $11.6 billion, the largest single move in the release, with computers up $7.6 billion and computer accessories up $5.7 billion; semiconductors fell $1.2 billion. Consumer goods increased $2.4 billion, with pharmaceuticals up $2.9 billion. Industrial supplies and materials fell $3.7 billion, including a $2.7 billion fall in nonmonetary gold, and crude oil imports dropped $1.3 billion.
Services were steadier. Exports of services rose $0.7 billion to $110.5 billion, with travel up $0.3 billion, and imports of services rose $0.8 billion to $79.7 billion.
Where the deficits sit
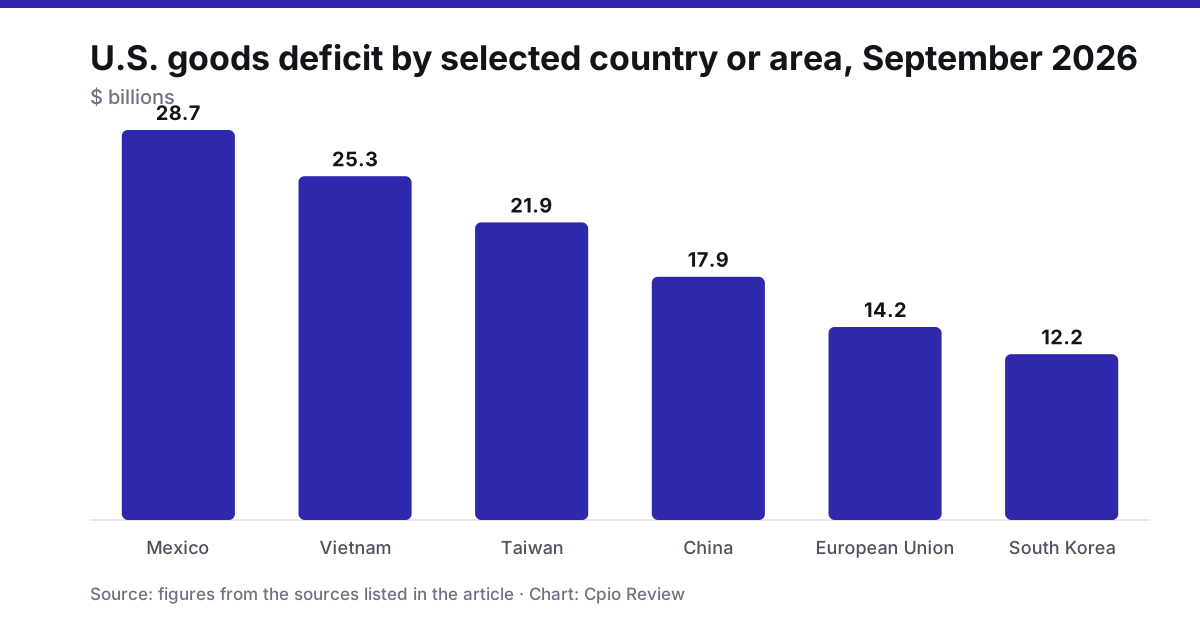
Among bilateral goods balances on a Census basis, September deficits were largest with Mexico ($28.7 billion), Vietnam ($25.3 billion), Taiwan ($21.9 billion) and China ($17.9 billion). The deficit with Taiwan widened $3.6 billion, as imports rose $4.2 billion to $27.3 billion. The European Union deficit widened $3.2 billion to $14.2 billion. The deficit with Canada narrowed $2.7 billion to $4.4 billion as imports fell $3.0 billion. The United States ran surpluses with the Netherlands ($7.7 billion), South and Central America ($6.2 billion) and the United Kingdom ($3.0 billion), among others.
The Taiwan and capital goods moves line up: computers and accessories were the biggest import gains, and those are products where Taiwan is a major supplier. The release does not link the two, so the match is an observation about the data, not a stated cause.
Why the deficit feeds GDP growth
Net exports enter gross domestic product as exports minus imports, so a narrower deficit adds to growth in a given quarter and a wider one subtracts. The BEA release carries a caution for that translation. When these statistics go into the national accounts, the BEA replaces trade in nonmonetary gold with an adjustment equal to domestic gold production minus industrial use. Gold was a swing factor in September, with exports and imports both lower, so the headline trade balance and the figure that reaches GDP can differ.
The release also reports real goods on a Census basis, in 2017 dollars, which is closer to what GDP uses. The real goods deficit increased $3.5 billion, or 3.0%, to $119.5 billion, compared with a 2.2% rise in the nominal Census-basis deficit. Real exports of goods rose 0.1% to $152.2 billion, while real imports rose 1.4% to $271.6 billion. In volume terms, then, imports outpaced exports, and the real balance widened even as the headline balance of payments deficit narrowed. The release explains the difference between the nominal series: the Census-basis goods deficit rose while the balance-of-payments goods deficit fell because of an adjustment for nonmonetary gold imports.
For anyone tracking GDP growth, the real series is the more relevant signal, and it points toward a larger drag from trade in volume terms in September. A single month of one quarter’s three does not settle the quarter, and the national accounts estimate will incorporate revisions and the other components.
What to watch
The next trade report, for October, is due Tuesday, December 8. It will show whether imports of computers and accessories keep rising and whether the three-month average, now $101.2 billion, continues to move higher. The real goods series and the gold adjustment are the two details most likely to explain gaps between the headline number and what shows up in GDP.
Prepared with AI assistance from the releases listed under Data sources and reviewed under our editorial policy. Not investment advice.