Cpio Review / BEA / Foreign Direct Investment
Foreign Direct Investment Position Reaches $5.86 Trillion in 2025
BEA's 2025 data put the U.S. direct investment position abroad at $7.14 trillion and foreign ownership at $5.86 trillion, led by Europe and manufacturing.
The monthly releases on prices and jobs get the attention, but the stock of cross-border capital sets the background for much of what they measure. On Tuesday the Bureau of Economic Analysis published its annual accounting of that stock for 2025, and the figures show both sides of it growing: American companies added $438.1 billion to their investment abroad, and foreign companies added $266.0 billion to theirs in the United States. The data come with downward revisions to the last three years that are worth reading alongside the new numbers.
Foreign direct investment, in the BEA’s framework, is a cumulative position: the value of ownership stakes of 10 percent or more that residents of one country hold in businesses in another. It differs from the portfolio flows that move with stock and bond prices, and it changes slowly, which is why a year-over-year rise of a few percent can still represent hundreds of billions of dollars.
What the 2025 foreign direct investment data show
The U.S. direct investment abroad position rose to $7.14 trillion at the end of 2025. Europe accounted for most of the increase, a $350.2 billion gain that was concentrated in the United Kingdom and Luxembourg. By industry, manufacturing contributed the largest increase, led by chemical manufacturing.
The foreign direct investment in the United States position stood at $5.86 trillion, up $266.0 billion. Europe led here as well, with a $182.4 billion increase. German multinationals had the largest single increase, at $49.0 billion, followed by Canadian multinationals at $39.2 billion. As on the outward side, manufacturing led by industry, with electrical equipment and components manufacturing at the top.
Put side by side, the two positions leave the U.S. with about $1.28 trillion more invested abroad than foreign firms hold at home on this measure.
Where the money sits
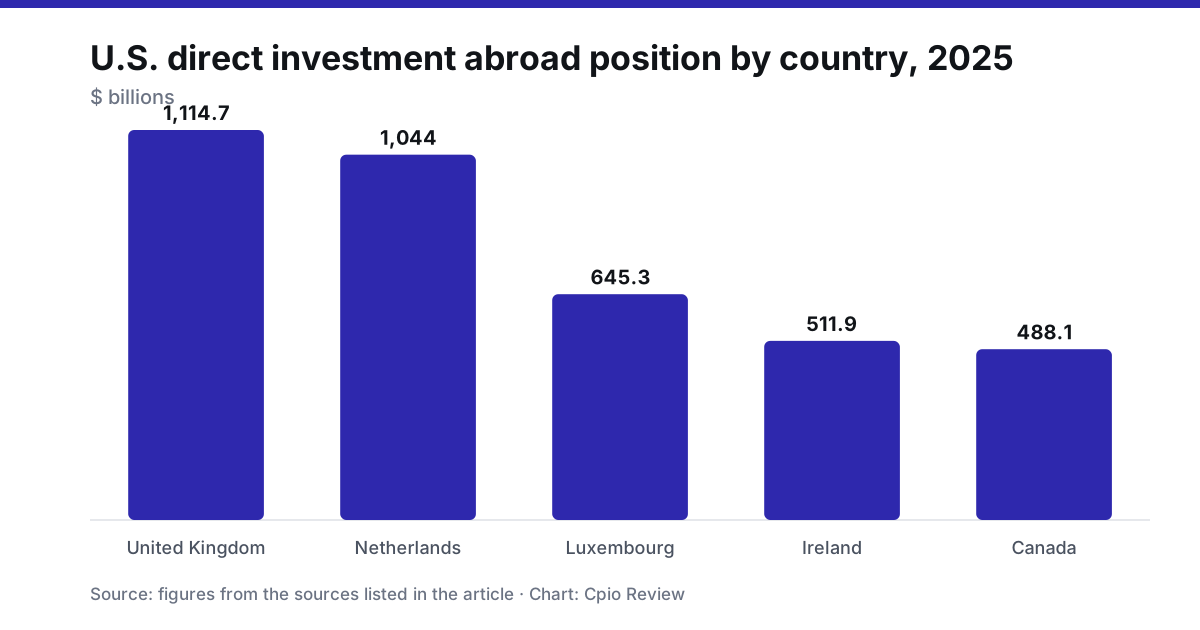
Five countries accounted for more than half of U.S. direct investment abroad. The United Kingdom was largest at $1,114.7 billion, ahead of the Netherlands at $1,044.0 billion, Luxembourg at $645.3 billion, Ireland at $511.9 billion and Canada at $488.1 billion. The list is dominated by countries that serve as hubs for holding companies and European operations, and the industry data bear that out: holding companies make up 45.8 percent of the total position abroad. Manufacturing affiliates account for 15.9 percent and finance and insurance affiliates for 13.5 percent.
Classifying by the industry of the U.S. parent gives a different cut. Manufacturing multinationals hold 50.2 percent of the position, and finance and insurance multinationals hold 15.8 percent. The difference between the two views is the point of the exercise. A manufacturer may route its foreign investment through a holding company in Ireland or the Netherlands, so the same dollars show up as manufacturing when sorted by parent and as holding companies when sorted by affiliate.
Earnings rose on the outward side. U.S. multinationals earned $660.1 billion on their investment abroad in 2025, an increase of 11.1 percent from 2024. Holding companies posted the largest gain, $40.0 billion, while income in finance and insurance fell by $6.3 billion.
Foreign ownership in the United States
Four countries account for more than half of foreign direct investment in the U.S. By country of the immediate foreign parent, Japan is at the top with $776.3 billion, followed by the Netherlands at $751.8 billion, Canada at $747.3 billion and the United Kingdom at $738.3 billion.
The BEA also reports the position by country of the ultimate beneficial owner, the entity at the top of the ownership chain. On that basis Japan is still first, at $827.1 billion, with Canada second at $819.8 billion and Germany third at $706.2 billion. The Netherlands and Luxembourg fall away, which the BEA reads as evidence that much of the investment from foreign parents in those two countries is ultimately owned by investors elsewhere. Anyone using the country-of-parent table to describe who owns American businesses should keep that caveat in view.
Manufacturing is the dominant destination, holding 42.8 percent of the position. Of the $2.51 trillion foreign investment position in U.S. manufacturing, chemical manufacturing accounts for a third, or $835.9 billion. Finance and insurance holds $629.7 billion and wholesale trade $534.0 billion.
Earnings moved in the other direction from the outward side. Foreign multinationals earned $310.1 billion on their U.S. investment in 2025, a decrease of 1.9 percent from 2024. American firms were making more on a position of $7.14 trillion abroad; foreign firms made slightly less on $5.86 trillion at home. A one-year change in income of that size can reflect profits, exchange rates and accounting adjustments in varying measure.
The revisions
The release also revises history. The BEA incorporated newly available and revised source data for U.S. direct investment abroad for 2023 and 2024 and for foreign direct investment in the United States for 2022 through 2024. The outward position for 2024 was lowered to $6,698 billion from $6,827 billion, and the 2023 figure to $6,598 billion from $6,620 billion. The inward position for 2024 was cut to $5,598 billion from $5,708 billion, for 2023 to $5,338 billion from $5,376 billion, and for 2022 to $5,110 billion from $5,124 billion. The 2024 revisions are the largest, at $129 billion on the outward side and $110 billion on the inward side.
Those corrections matter for how the 2025 increases are read. Measured from the revised 2024 base, the outward position rose by $438.1 billion, which is the figure the BEA reports. Anyone comparing the new $7.14 trillion with last year’s published $6.83 trillion would understate the gain.
The BEA also noted that it has changed its disclosure avoidance method to coarsening, which uses rounding, aggregation and ranges, a change it says allows it to publish more data while still protecting survey respondents.
Why it matters for the macro picture
Direct investment is a slow-moving series, and it does not feed into the quarterly estimates of GDP growth the way consumer spending does. Its relevance is as context. It shows where American companies earn income abroad, which feeds into the primary income balance in the current account, and where foreign companies employ and invest in the U.S., particularly in manufacturing and chemicals. The next annual update is due in July 2027. In the meantime, the BEA’s quarterly international transactions releases give a more current view of cross-border financial flows.
Prepared with AI assistance from the releases listed under Data sources and reviewed under our editorial policy. Not investment advice.